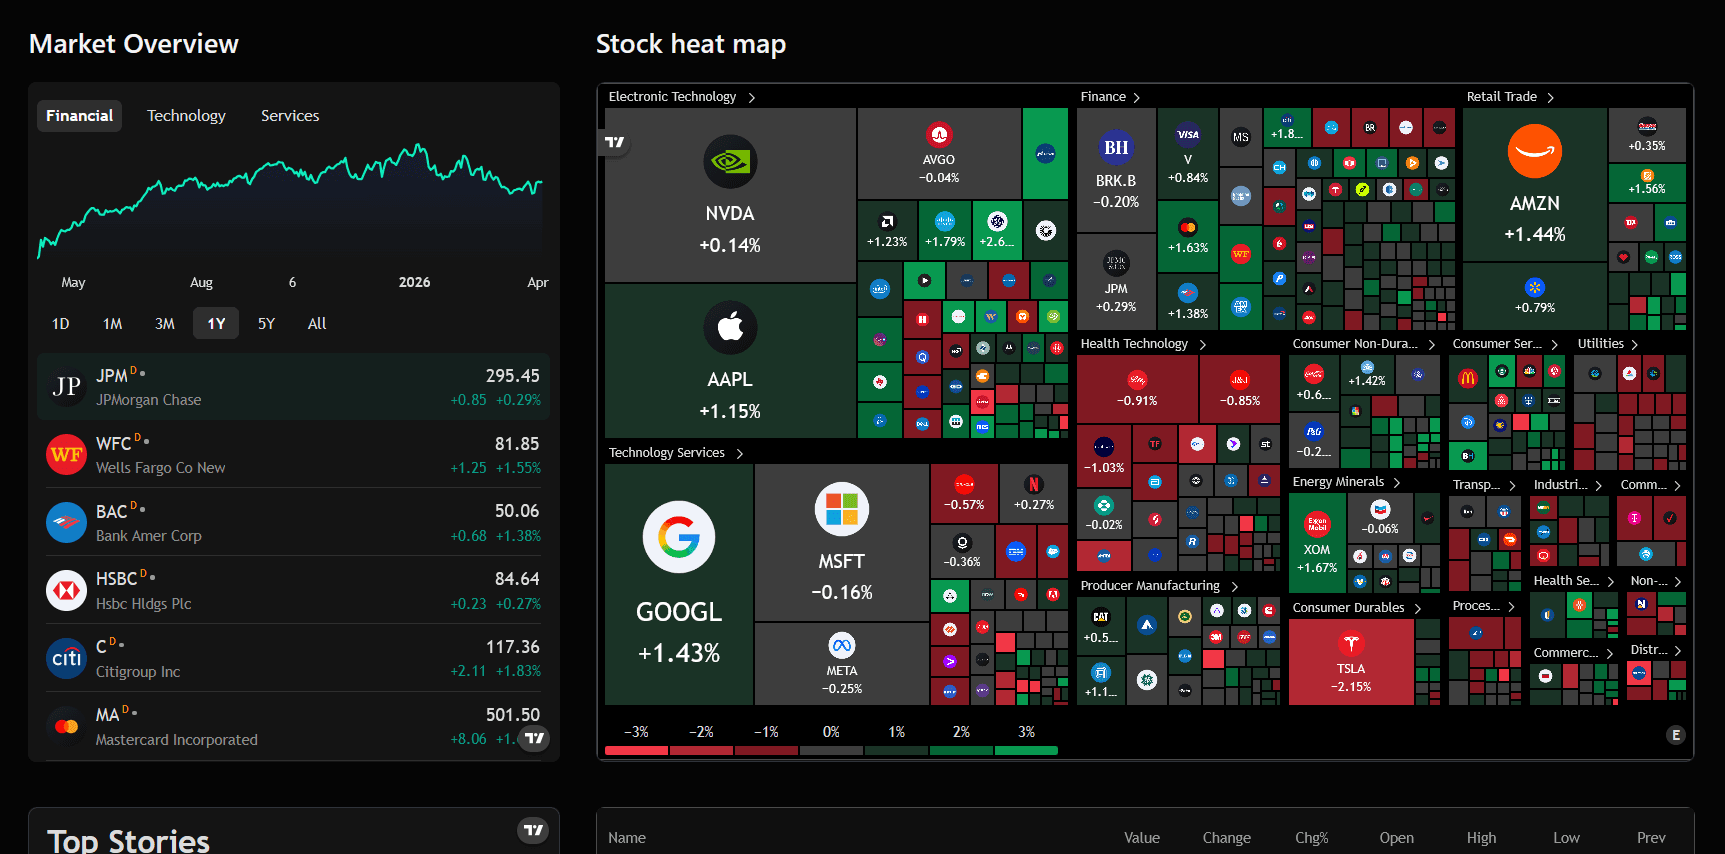
Currently in active development: A fintech dashboard for real-time market data visualization and portfolio tracking. Built with TypeScript, Next.js, and modern charting libraries.
Terminal X is a Bloomberg-inspired fintech dashboard designed for retail investors who want institutional-grade data visualization. The application pulls real-time market data and renders it through interactive charts with sub-second update intervals.
Key features include portfolio performance tracking with P&L analysis, multi-timeframe candlestick charts, a watchlist with customizable alerts, and sector heatmaps. The charting engine uses lightweight-charts for performant WebGL rendering.
Built entirely in TypeScript with Next.js, the application leverages server-side rendering for initial page loads and client-side streaming for real-time data updates. The design system uses a dark terminal aesthetic with accent colors for data visualization.